Resiliency for AIX systems
Unleash the power of your professional systems. Reduce downtimes. Faster solve incidents.
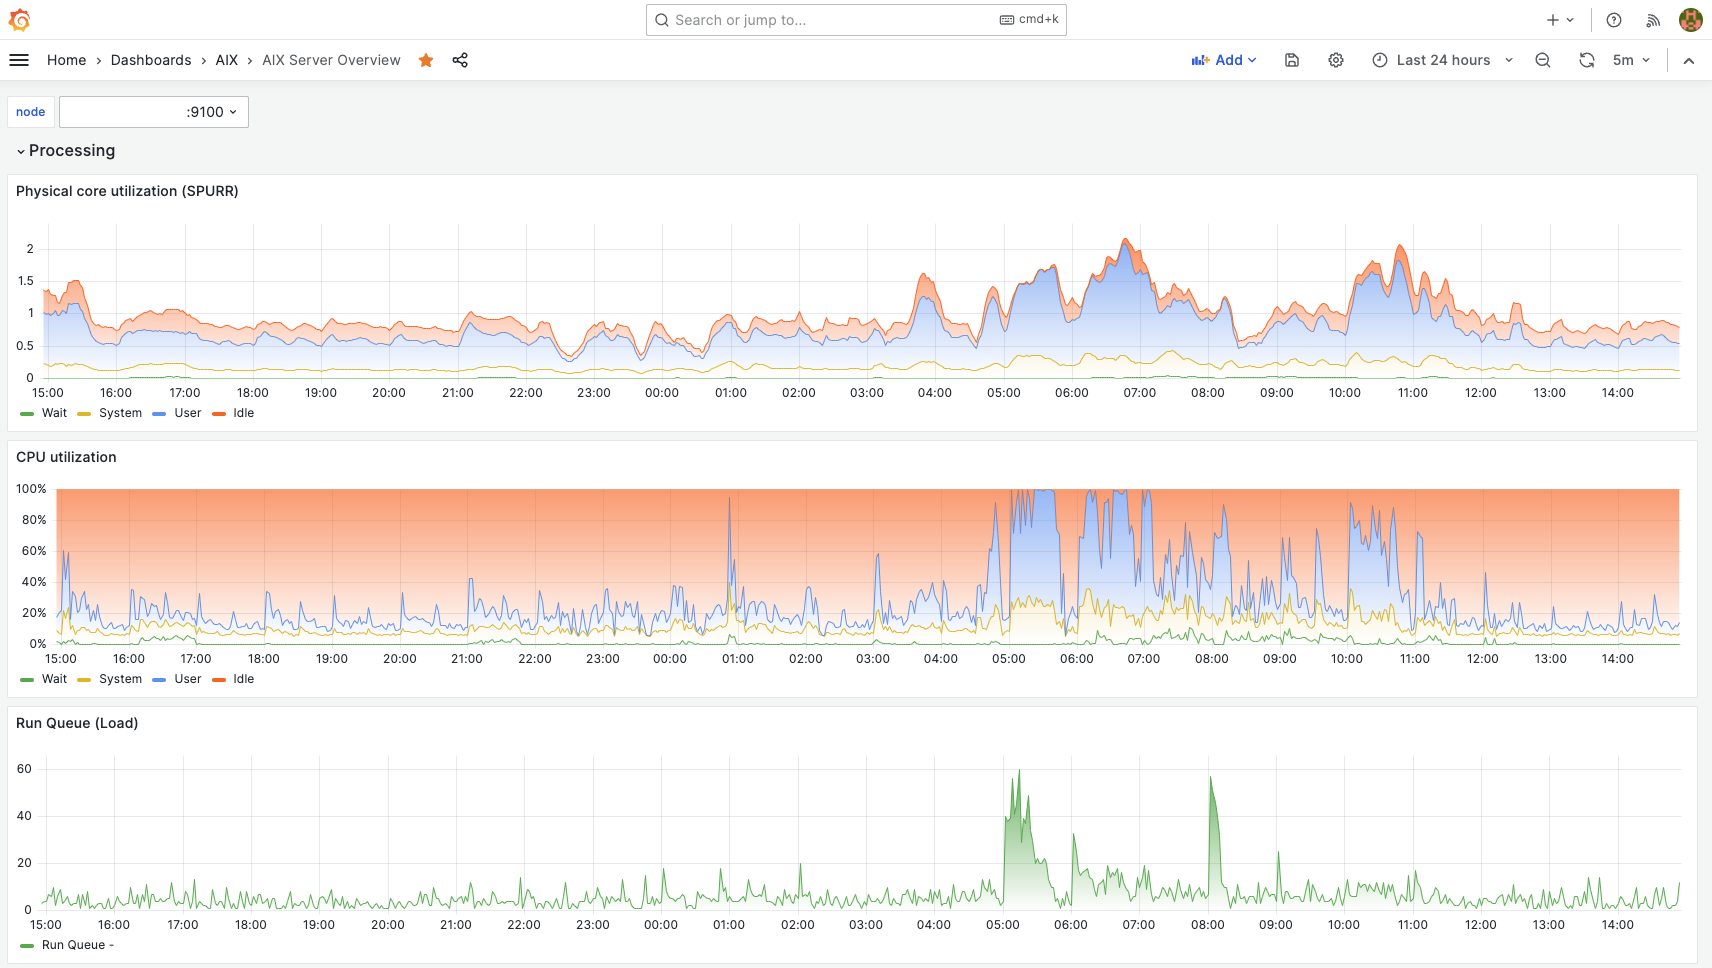
Your systems metrics are now ready to be visualised into modern dashboards using Grafana: select the time range, zoom in, zoom out, select only the required series of data. Thanks to the Grafana data source for Prometheus.
Fine search your data, filter and zoom your charts for details, dig for unexpected system behaviours or whatever you are looking for. This is all available in a modern custom set of dashboards, just right now.
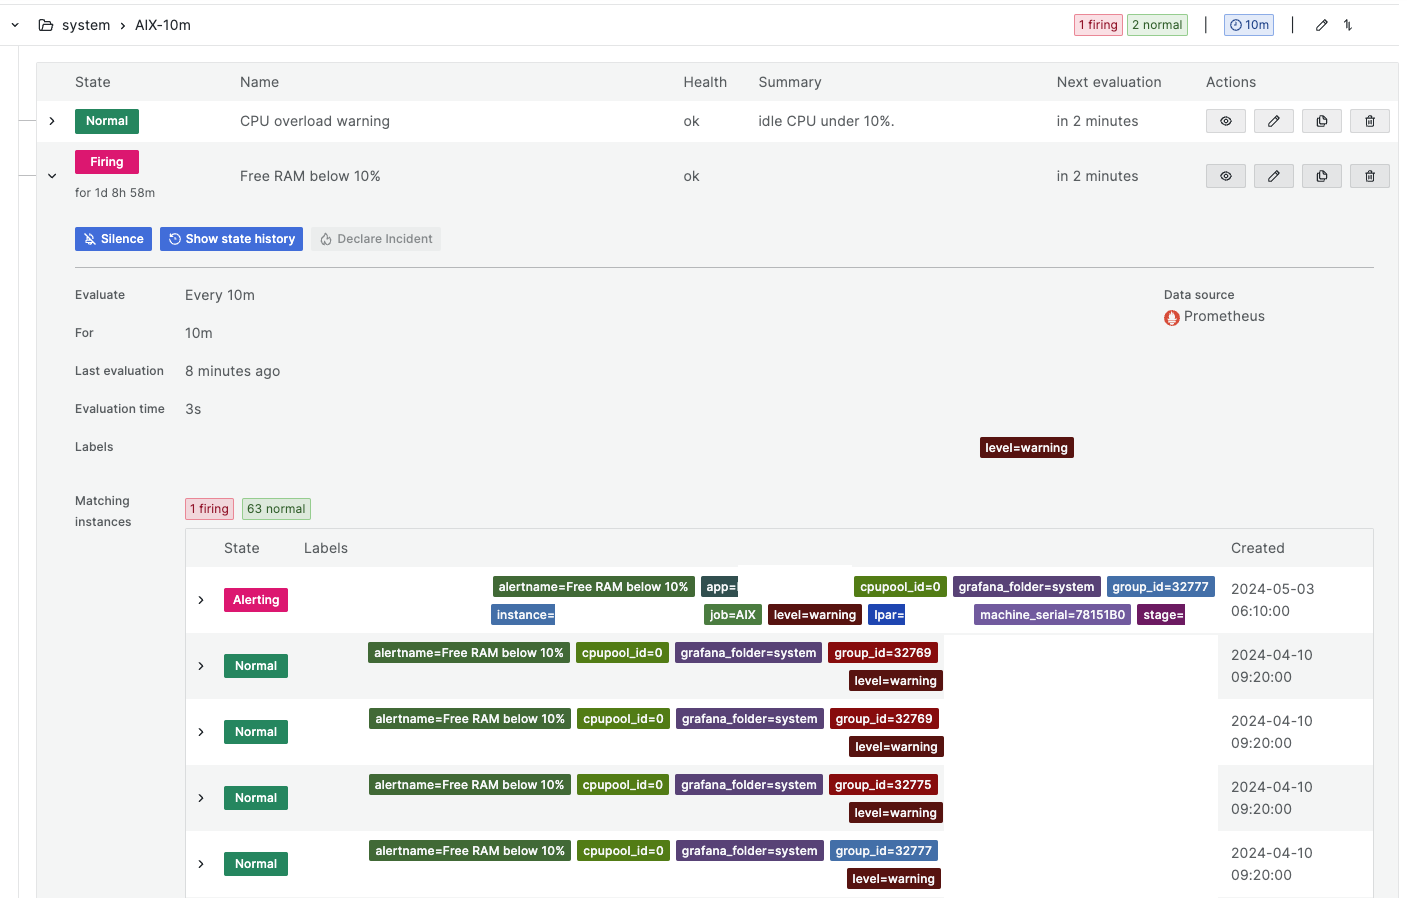
Get real time alerts
Visualising is nice, but getting real time alerts is better. Using your favorite alert manager, such as the Prometheus one, or Grafana one, you get alerts when something turns wrong on your system.
Create simple and efficient rules applying to all your AIX systems, including VIO servers. Use Prometheus tags to provide details informations into your alert messages.
Prometheus4Aix exporter include specific tags depending on the monitored resource. For example: lpar name, pseries name, processor reference and so on.
All alerts channels are available: emails, Discord, Slack, Telegram, Line, Webhook and many more.

Production ready
Prometheus4Aix software runs extensively for months on huge and also small pSeries systems: from a 0.1 EC and 10GB LPAR to 256 VCPU and 512 GB RAM’s one, we are truly confident Prometheus4Aix will run smoothly on your systems as well.
Ten of thousands of metrics are monitored each minutes, on different versions of the AIX system, and the whole exporter footprint is insignificant for usual CPU, RAM and I/O resources.
Prometheus4Aix supports all versions of the 7.x family for pSeries systems: 7.1, 7.2 and 7.3. It also supports VIO servers based on AIX 7.
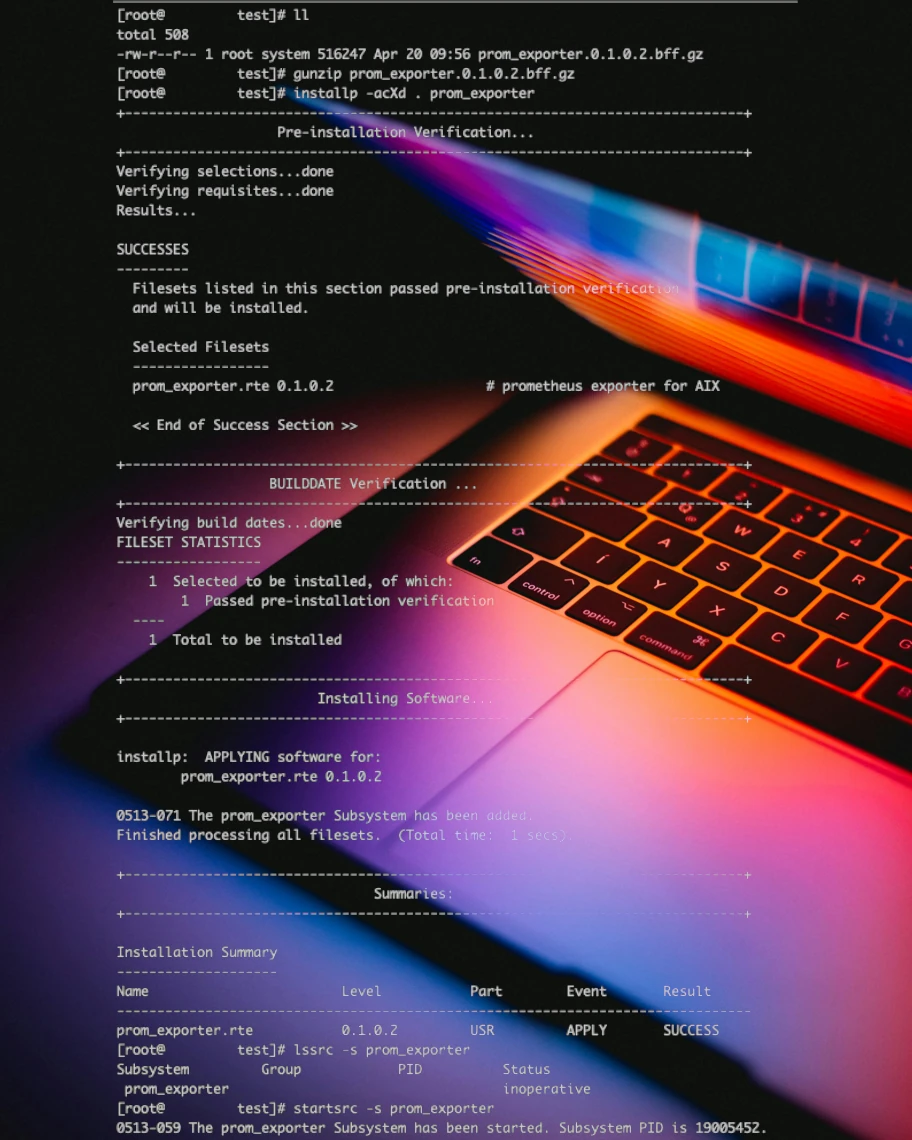
KISS installation
“Keep it simple, stupid!” is our mantra, too:
-
- Install the fileset bundle
-
- Configure a scrap in your Prometheus server
-
- Visualize your metrics into Prometheus, Grafana or any compatible framework